Reproducible Research with Org Mode, Fennel, and LÖVE
Today I would like to talk about three separate tools, and how we can combine them with the power of Emacs.
Our tools for today are:
- Fennel - a Lisp-like surface syntax for Lua that makes programming in Lua fun and more robust.
- Org Mode - a markup language and an application inside Emacs, which allows its users to create documents that include interactive pieces of code.
- LÖVE - a game engine that allows programming games in Lua.
This post is itself a program, describing how you could create similar Org documents and explore literate programming/reproducible research with Fennel, or other languages for that matter.
It’s possible thanks to Org Mode and my new package ob-fennel, which implements necessary functions for sending Fennel code blocks to the REPL process.
For a better experience, you should read this in Emacs, and you can get the original .org file from here.
If you want to follow the instructions, make sure to install Fennel and LÖVE for this to work.
Bootstrapping LÖVE
First, we need to bootstrap LÖVE so it could understand Fennel code:
local fennel = require "fennel"
table.insert(package.loaders or package.searchers, fennel.searcher)
We’ve required fennel the library and registered the fennel.searcher function as one of the functions responsible to loading files.
With that, theoretically, we no longer need to write any more Lua code, and instead, we can write in Fennel, and then use plain Lua’s require to load the files.
Let’s create a REPL (Read Eval Print Loop) that will allow us to do interactive programming in LÖVE via its thread and event systems.
First, let’s require fennel once again, and also require love.event.
Next, we’ll do a little trick that I’ll explain later, but for now, we’ll only need to capture the module-scope value of ... into variables event and channel:
(local fennel (require :fennel))
(require :love.event)
This will make sense in a moment.
Now, we need a REPL itself.
REPL consists of the prompt that asks for more input, and the loop that calls the prompt which reads some input and sends it to a channel.
Let’s define the prompt function first:
(fn prompt [next-line?]
  (io.write (if next-line? ".. " ">> "))
  (io.flush)
  (.. (tostring (io.read)) "\n"))
Now, we can create the infinite loop, that will read from stdin and push the read value into LÖVE’s event system.
That’s where we’ll use the captured event variable, however, we’ll need to run this loop only in a LÖVE thread, so we’ll check if the channel was bound:
(match ...
  (event channel)
  (while true
    (match (channel:demand)
      [:data output] (print (table.concat output "\t"))
      [:read cont?] (love.event.push event (prompt cont?))
      [:error kind & data]
      (print (string.format
              "%s error: %s" kind
              (accumulate [msg "" _ message (ipairs data)]
                (.. msg (tostring message))))))))
Once data appears in the channel, this function exterminates what pattern it received. It is always a table, where the first element means the kind of data, and the rest of the table is the data itself. That’s the protocol we’re going to write in a moment.
The loop check if the event-type is either :data or :error and acts accordingly.
In addition to that, there’s a third event-type :next-line which represents the situation when the REPL receives incomplete input and waits for more lines.
Let’s implement this protocol:
(let [thread (-> "repl.fnl"
                 love.filesystem.read
                 (fennel.compileString nil)
                 (love.filesystem.newFileData :repl)
                 love.thread.newThread)
      io-channel (love.thread.newChannel)
      coro (coroutine.create #(fennel.repl $...))]
  (->> {:readChunk (fn [{: stack-size &as vaiv}]
                     (io-channel:push [:read (> stack-size 0)])
                     (coroutine.yield))
        :onValues (fn [data]
                    (io-channel:push [:data data]))
        :onError (fn [kind ...]
                   (io-channel:push [:error kind ...]))}
       (coroutine.resume coro))
  (thread:start :eval io-channel)
  (set love.handlers.eval #(coroutine.resume coro $)))
This is an asynchronous REPL, made with Lua’s coroutines.
You may wonder, how it will start the loop function if it was under the when channel guard, but that’s exactly what this piece of code does.
First, it loads itself via love.filesystem.read and compiles Fennel code to Lua via fennel.compileString function.
Next, this compiled representation is used to create a FileData object, that is used to start a LÖVE thread with the love.thread.newThread function.
So this module will be executed twice - first when main.lua loads the file, and second, when LÖVE spawns the thread, but were not there, yet.
After we’ve created the thread we create an io-channel and the REPL coroutine.
Next, we start the coroutine by passing it a table of functions, each of which will push data to the io-channel.
Importantly, the readChunk function pauses the coroutine after every read, allowing it to run asynchronously within the main thread.
Finally, we start the thread by passing :eval which will be bound to the event variable, and io-channel which will be bound to channel.
This thread spins the loop function, which blocks the thread waiting for the input, while the main LÖVE thread continues to run.
With all of that, we can finally require the repl.fnl file in the main.lua like this:
require "repl"
Also, let’s disable vsync while we’re at it. For some reason, it makes the REPL slow on my machine. We won’t be needing it anyway:
function love.conf(t)
  t.window.vsync = 0
end
Now we can start hacking in real time!
Drawing plots
Since we’re done with the literate programming example, let’s look at how the reproducible research can be organized. I’m sure you should be familiar with the concept of a notebook, like R Markdonw or Jupiter. We’re going to achieve something like that.
If you’re reading this file in Emacs, which you should, press the C-c C-v t shortcut, which will run the org-babel-tangle function.
After executing it, Emacs will create three files main.lua, conf.lua, and repl.fnl in the same directory as this file.
If you’re not reading this file in Emacs, then, well, get Emacs, or just believe me - it works.
Let’s plot a function via LÖVE2D and Fennel. I’m not sure if there’s a library for drawing plots with LÖVE, but it’s ain’t fun to use something like that anyways, so let’s build our own! First, we’ll need a Canvas object to draw to:
(local canvas (love.graphics.newCanvas 640 480))
Put the cursor in this source code block and press C-c C-c shortcut (or call the org-babel-execute-src-block function with M-x)
The empty LÖVE window will appear, and Emacs will display a message in the prompt area, with the contents something like “Please re-evaluate once Fennel is initialized”.
We won’t be needing this window, so you can minimize it - we’ll be drawing off-screen onto a canvas and then saving it as an image.
Org-mode provides us with all we’ll need to preview results without leaving Emacs.
Once Fennel is loaded, and all threads were spawned, hit C-c C-c again, and you should see "nil" in the echo area.
This means that the code was executed successfully and the canvas variable was created.
Now, let’s write a function that will draw a grid to the active canvas.
First, we’ll need a function that will calculate the grid step based on the zoom level.
Our zoom level is represented in percentages, which we’ll later convert to values by dividing by 100.
However, for our grid, we will be doing an infinite zoom with finite details.
This function computes the step between each grid line based on current zoom level.
(fn calc-step [zoom]
  (let [gscale (^ 10 (bit.bor (math.log zoom 10) 0))]
    (* zoom 100 (/ gscale))))
It’s a bit convoluted, but the key here is the bitwise or operator - that’s what makes our grid cycle between zoom levels properly.
We now can define the function that computes and draws the grid itself:
(fn draw-grid [zoom]
  (let [(w h) (: (love.graphics.getCanvas) :getDimensions)
        step (calc-step zoom)]
    (love.graphics.setColor [1 1 1 1])
    (love.graphics.rectangle :fill 0 0 w h)
    (love.graphics.setLineWidth 1)
    (each [_ [step color]
           (ipairs [[(/ step 10) [0.7 0.7 0.7 (/ (% step 1000) 1000)]]
                    [(* step 1) [0.9 0.9 0.9 (- 1 (/ (% step 1000) 1000))]]])]
      (let [grid []]
        (fcollect [x (+ (/ w 2) step) w step     :into grid] [x 0 x h])
        (fcollect [x (- (/ w 2) step) 0 (- step) :into grid] [x 0 x h])
        (fcollect [y (+ (/ h 2) step) h step     :into grid] [0 y w y])
        (fcollect [y (- (/ h 2) step) 0 (- step) :into grid] [0 y w y])
        (love.graphics.setColor color)
        (each [_ line (ipairs grid)]
          (love.graphics.line line))))))
This function actually draws two grids - one for unit size, and one for 1/10 of the unit size, and applies dynamic transparency based of the zoom level.
This way, we can create an illusion of the infinite zoom level, that
It’s a bit verbose, but all it really does is create a table of line segments from the center of the canvas in all four directions with the calculated step interval.
This only draws the grid, though, we also need to draw the X and Y axis, with some markings indicating the zoom level:
(fn draw-axis [zoom]
  (let [(w h) (: (love.graphics.getCanvas) :getDimensions)
        step (calc-step zoom)]
    (love.graphics.setLineWidth 1)
    (love.graphics.setColor [0.3 0.3 0.3 1])
    (love.graphics.line [(/ w 2) 0 (/ w 2) h])
    (love.graphics.line [0 (/ h 2) w (/ h 2)])
    (let [h (/ h 2) w (/ w 2)]
      (for [x step w step]
        (love.graphics.line [(+ x w) h (+ x w) (+ h 2)])
        (love.graphics.print (string.format "%.1f" (/ x zoom)) (+ x w) (+ h 5)))
      (for [x (- step) (- w) (- step)]
        (love.graphics.line [(+ x w) h (+ x w) (+ h 2)])
        (love.graphics.print (string.format "%.1f" (/ x zoom)) (+ x w) (+ h 5)))
      (for [y step h step]
        (love.graphics.line [w (+ y h) (+ w 2) (+ y h)])
        (love.graphics.print (string.format "%.1f" (- (/ y zoom))) (+ w 5) (+ y h)))
      (for [y (- step) (- h) (- step)]
        (love.graphics.line [w (+ y h) (+ w 2) (+ y h)])
        (love.graphics.print (string.format "%.1f" (- (/ y zoom))) (+ w 5) (+ y h)))
      (love.graphics.print 0 (+ w 5) (+ 5 h)))))
This function works similarly to the draw-grid one, except it only draws two lines intersecting at the canvas’ center, and the numbers, indicating units of measure.
Each number also has a small mark at the axis for better readability.
Finally, let’s write a function plot that will accept a function fun which it will plot on the canvas, and some additional arguments, like from, to, step.
Also, did I mention that you should press C-c C-c on each code block in this section?
It will send the code to the running LÖVE process, and we will be able to see the results dynamically.
But before we do that, let’s write a function that transforms so-called world coordinates to screen coordinates:
(fn world->screen-coordinates [[x y] zoom]
  (let [(w h) (: (love.graphics.getCanvas) :getDimensions)]
    [(+ (* x zoom) (/ w 2)) (+ (- (* y zoom)) (/ h 2))]))
Oh, and we also need a function for generating a unique file name for the output image:
(fn unique-fname [name suffix]
  (let [(base ext) (string.match name "(.*)%.(.-)$")]
    (if (love.filesystem.getInfo
       (.. base (or suffix "") "." ext))
      (unique-fname name (+ (or suffix 0) 1))
      (.. base (or suffix "") "." ext))))
Alright, here’s the plot function:
(fn plot [{:fun f : from : to : step : zoom}]
  (let [image (unique-fname "result.png")]
    (canvas:renderTo
     #(let [zoom (/ (or zoom 100) 100)
            (w h) (: (love.graphics.getCanvas) :getDimensions)]
        (draw-grid zoom)
        (draw-axis zoom)
        (love.graphics.setColor [1 0 0 1])
        (love.graphics.setLineWidth 1)
        (let [points (fcollect [x from to (or step 0.1)]
                       (world->screen-coordinates [x (f x)] zoom))]
          (each [i [x1 y1] (ipairs points)]
            (match (. points (+ i 1))
              [x2 y2] (love.graphics.line x1 y1 x2 y2))))))
    (: (canvas:newImageData) :encode :png image)
    (.. (love.filesystem.getSaveDirectory) "/" image)))
This function uses the renderTo method of the canvas object.
It accepts an anonymous function, which draws the gird, the axis, sets the color of the plot to red, and finally draws the plot with love.graphics.points.
We can execute it like that, by pressing C-c C-c on the next code block:
(plot {:fun #(* $ $) :from -50 :to 50 :step 0.01 :zoom 5000})
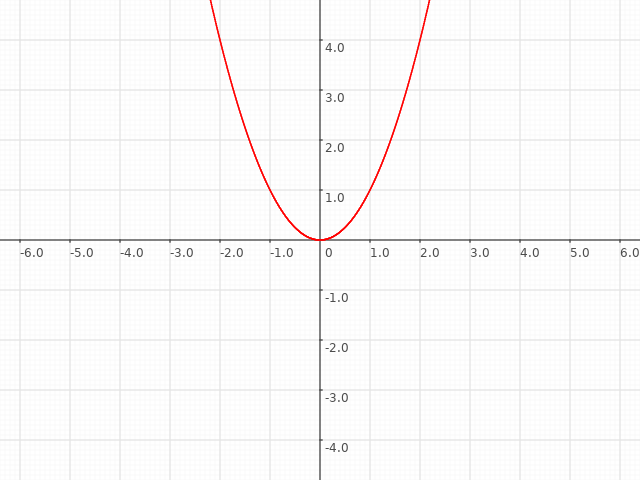
This produces an image, which you should see if you call the org-toggle-inline-images function.
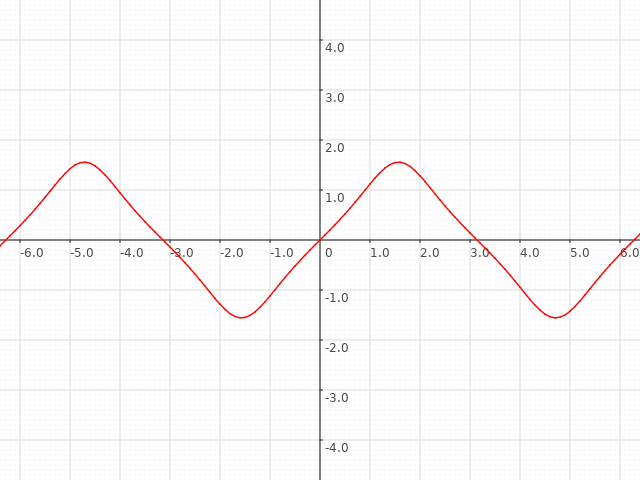
As you can see, it plots a simple  function, but we can plot any other, like
  :
:
(plot {:fun #(math.tan (math.sin $)) :from -10 :to 10 :zoom 5000})
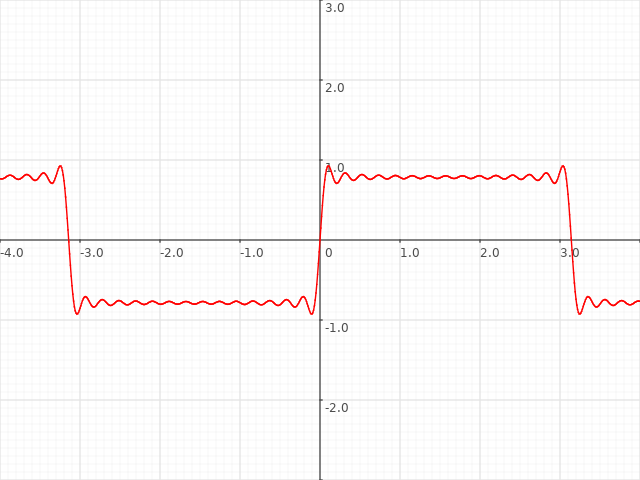
Or a more complex example would be generating a square wave via this formula  :
:
(plot {:fun #(accumulate [res (math.sin $)
                          _ k (ipairs (fcollect [k 3 29 2] k))]
               (+ res (/ (math.sin (* $ k)) k)))
       :from -500 :to 500 :step 0.01 :zoom 8000})
You get the idea.
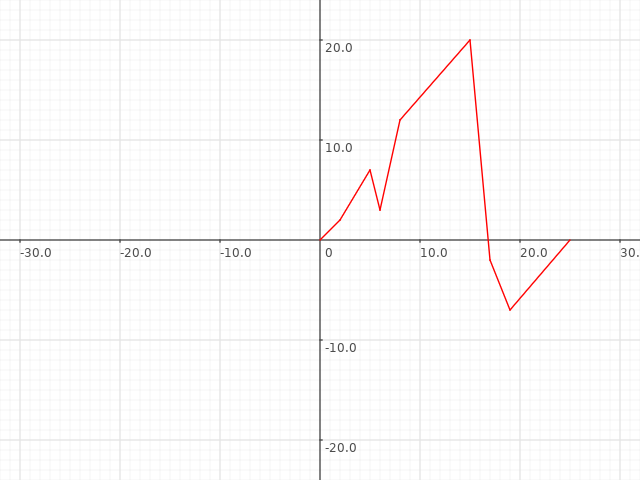
Additionally, we can create a function that plots Org tables, like this one:
| x | y |
|---|---|
| 0 | 0 |
| 2 | 2 |
| 5 | 7 |
| 6 | 3 |
| 8 | 12 |
| 15 | 20 |
| 17 | -2 |
| 19 | -7 |
| 25 | 0 |
The function is mostly similar to plot except instead of calling a function it just goes through each table row, and builds line segments to draw:
(fn plot-table [{: data : zoom}]
  (let [image (unique-fname "result.png")]
    (canvas:renderTo
     #(let [zoom (/ (or zoom 1000) 100)
            (w h) (: (love.graphics.getCanvas) :getDimensions)]
        (draw-grid zoom)
        (draw-axis zoom)
        (love.graphics.setColor [1 0 0 1])
        (love.graphics.setLineWidth 1)
        (each [i row (ipairs data)]
          (let [[x1 y1] (world->screen-coordinates row zoom)]
            (match (. data (+ i 1))
              next-row
              (let [[x2 y2] (world->screen-coordinates next-row zoom)]
                (love.graphics.line x1 y1 x2 y2)))))))
    (: (canvas:newImageData) :encode :png (string.format image))
    (.. (love.filesystem.getSaveDirectory) "/" image)))
We can plot it like this, passing the table via the :var data=lines header property:
(plot-table {: data :zoom 1000})
You can build more complex functions, that, for example, draw several graphs on the same canvas, or draw entirely different types of graphs altogether. Though this requires defining functions for all these kinds of visualizations, and I guess this is why people tend to use other languages for the task, like R.
Inline evaluation
Well, graphs are cool and all, but what about supplying values into the text directly? We can do that too, and although, we could do this in our LÖVE REPL, that’s a great opportunity to showcase another ability of Org Babel - run multiple instances of Fennel, using completely different environments!
For example, suppose we have some kind of a formula, that, for example, calculates the Ackermann function:
(fn A [m n]
  (if (= n 0) 0
      (= m 0) (* 2 n)
      (= n 1) 2
      (A (- m 1)
         (A m (- n 1)))))
We can define the function  using the
 (fn square [n] (A 1 n)), and use it like (square 4) producing 16 as a result.
Or, we can define a function that computes  like this:
 (fn two⇈n [n] (A 2 n)).
Calling it as (two⇈n 4) gives us 65536.
These code blocks are running in a separate session, using a regular Lua interpreter, instead of our LÖVE REPL.
This is done by specifying the :session header argument, and giving it a name, which instructs ob-fennel to spawn a new process.
Upon exporting, the results of the inline evaluation would update automatically which eliminates the problem of stale data in the paper.
The results always reflect the actual code they were computed with.
The power of Org
The examples above are just the tip of the iceberg of what you can do with the Org package. Back when I wasn’t an Emacs user, I often found threads on the topic “why should I use Emacs?” and each of these threads contained at least one answer which just said “Org Mode”. I never understood why - what’s so good about Org that I can’t get from, say, Markdown?
Since then, I’ve switched to Emacs and started this blog, using Org Mode, Hugo, and the ox-hugo package.
Org mode has a built-in exporting engine, which can export .org files to PDF, ODT, LaTeX, Markdown, or HTML files.
The ox-hugo package adds another backend for this engine, which exports to Hugo compatible markdown, which is then used by Hugo to build this website.
And when I was starting this blog, I wasn’t sure that I made the right investment - I’ve just switched to Emacs a couple of months before, and I’m using this Org thing for writing. I was uneasy because if I would stop enjoying writing in this setup I might lose all motivation for writing altogether. But thankfully, I’ve liked the Org+Hugo combination, and it became the reason why I haven’t left Emacs since - it’s just too good as a writing experience.
Literate programming was the way I learned Org.
I’ve used it to configure Emacs because Org Mode provides a way to load .org files as Emacs Lisp files, and you can replace your init.el with init.org if you want to.
But to be honest, it’s a fun experiment, but I don’t find literate programming to be that practical.
It’s even harder to consider, given that there aren’t a lot of tools besides Emacs, that allows writing programs in this style using any language.
And you can’t just make your coworkers use Emacs all of a sudden.
Yes, there are solutions specific to a particular language, but they lack usability in my opinion.
Reproducible research was a hot topic lately, and the growing popularity of Jupiter notebooks is a great indication. Org Mode might not provide all the fancy UI elements, that Jupiter notebook has, but theoretically speaking, nothing prevents you from writing a UI in a standalone tool, like the game engine, and using it as a rendering frontend from the comfort of Emacs. This post partly shows this, although, I went a more static route with embedded images. But still, anything is possible if you have the dedication to do it.
I hope this post was an interesting read, and you’ve become interested in Emacs and Org Mode, or even in Fennel and LÖVE combo. Feel free to contact me if you have any questions on the topic. See you soon!